
Megan Langford
We will attempt to predict
future values for stamp prices in the United States by analyzing the historical
behavior of the prices over time.
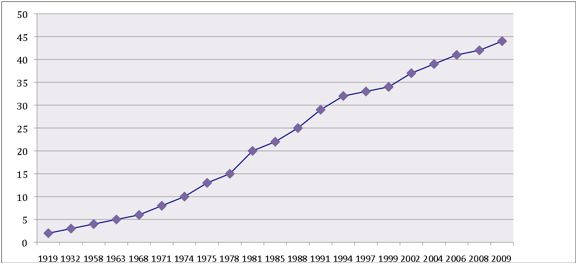
Here is a graphical display
for the actual stamp prices in the United States over its history.
Now we will apply several
different types of functions to see which one best represents the behavior of
the data.
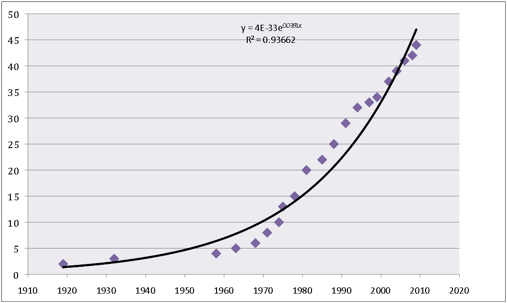
First, by using an
exponential function to best explain the shape of the data, we get the
following graph:
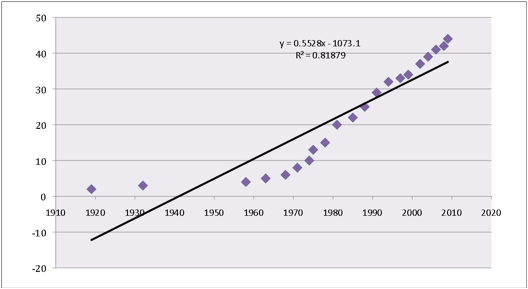
Next, by using a linear
function to best explain the shape of the data, we get the following graph:
Finally, by using a power
function to best explain the shape of the data, we get the following graph:
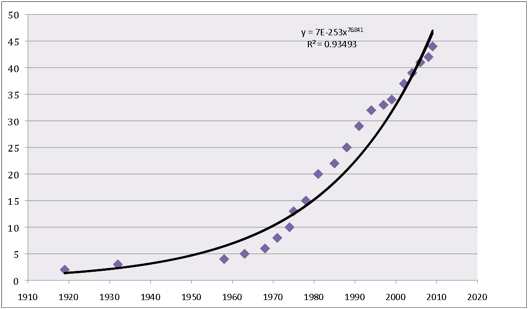
Notice that for each of our
graphs, the equation for the trend line is shown above the data in y= format.
The ![]() value
rates the predictability strength of the function for the data set. For regression analysis purposes, the
value
rates the predictability strength of the function for the data set. For regression analysis purposes, the ![]() value
closest to 1 indicates which function most closely relays the data
behavior.
value
closest to 1 indicates which function most closely relays the data
behavior.
Although all three function
types appear closely related to the data, the ![]() value
closest to 1 is the one for the exponential function. We can also see it is very close to the data set because the
data points all fall very close to the graph of the function.
value
closest to 1 is the one for the exponential function. We can also see it is very close to the data set because the
data points all fall very close to the graph of the function.
We now know which method
will best predict the values of stamp prices for years to come. Now let’s expand our data table using
the exponential function created to best fit the data in order to predict
future stamp prices.
Year Stamp
Price (cents)
|
2006 |
41 |
|
2008 |
42 |
|
2009 |
44 |
|
|
|
|
2010 |
48.8503725 |
|
|
|
|
2017 |
64.21871262 |
|
2018 |
66.77780289 |
|
2019 |
69.43887189 |
|
|
|
|
2028 |
98.70460924 |
|
2029 |
102.6379488 |
|
2039 |
151.7096729 |
|
2049 |
224.2428372 |
We can now see that we can
expect the price to rise more than 3 cents (actually, close to 5 cents) in the
next year. The price should reach
64 cents by 2017, and $1 by 2029.
So will this function be
accurate for predicting stamp prices for any year we ask it to?
First, let’s attempt to
obtain an expected stamp price for a year prior to the start of the data
set. When we input the year 1800,
the function gives us an expected stamp price of about a hundredth of a
cent. In reality, U.S. stamps were
not created until 1847.
Taking a look 100 years from
now, our function predicts the stamp price will reach $23.38 by 2109. Even with a high rate of inflation from
now until then, this seems rather unlikely. In perspective, this means that stamp prices have increased
from 2 cents to 44 cents over the last 100 years, and they will rise from 44
cents all the way to $23.38 over the next 100 years.
The lesson to learn from
this exercise is that although our function is extremely useful for the years
relatively near our data set, the variables may have very different behavior as
we get further away from our known data set. In reality, this is true for most methods of creating best
fit lines.